Navigation Menu: Dashboard

TIP: When accessing the platform, use Google Chrome for the best results.
Overview
This article provides an overview of the features and functions of the dashboard and its components. Video tutorial: Dashboard Landing Page.
In the management console, the dashboard includes data for all customers, accounts, and cloud provider programs authorized for your business.
The dashboard is flexible. Filters make it simple to customize your view. The report drill-downs provide quick access to underlying reports. You can understand key metrics like margins by utilizing new data sets, such as seller and customer costs.
Customize the dashboard by adding KPI cards, adjusting the filters, and changing the chart style. You can...
- Select custom date range
- View based on local currency
- Add and design KPI cards
- Change the order of KPI cards
- Save custom views
- Subscribe to custom dashboard views
- To view the KPI card's data and download the report as a CSV file, click the 'Show Report' option.
The figure below is a view from the reseller's dashboard. Click on the image to magnify.

Sample Design layouts
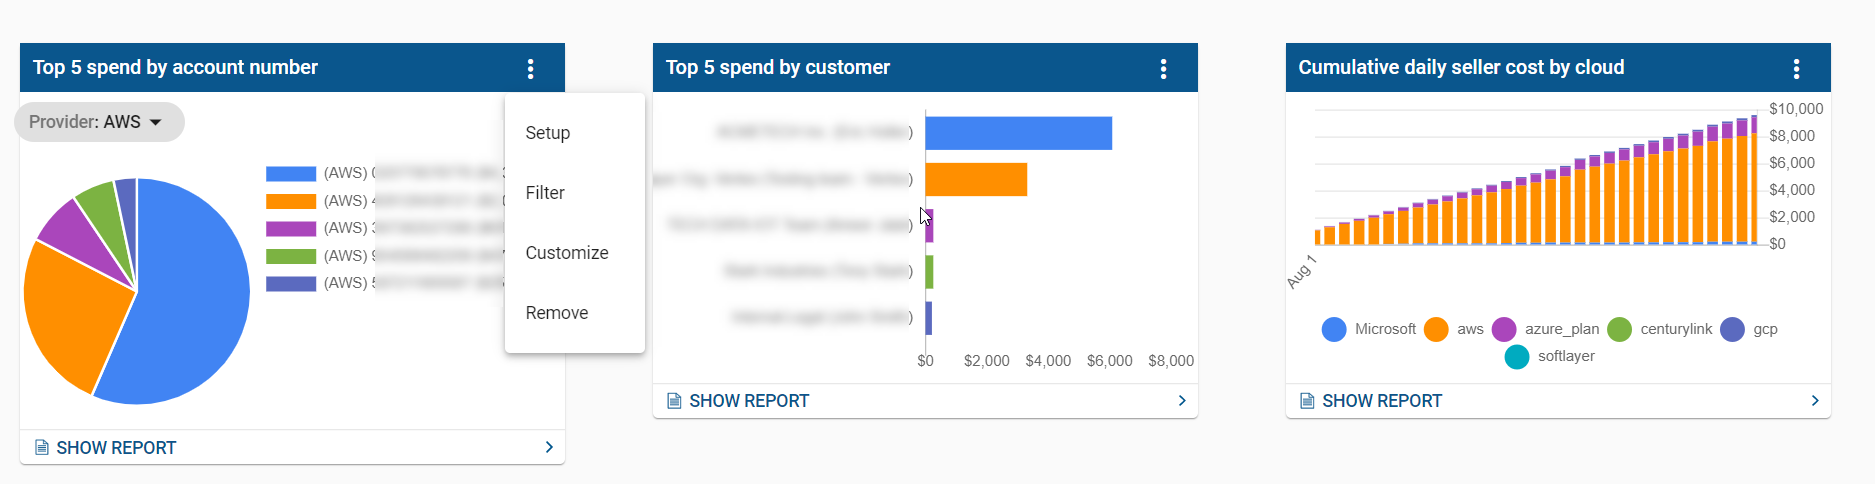
Setup and Filter Options
 |  |
Customize
You can change the KPI title and chart style and toggle on or off the values you want to see on the card.

The dashboard in the customer storefront contains data for each cloud provider and associated accounts/subscriptions. The customer storefront does not display the seller's cost.
The figure below is a view from the customer portal. Click on the image to magnify.

To submit a support request in StreamOne Ion, click the "?" icon in the upper right menu bar or click the Support button in the menu. Alternatively, you can click Submit a ticket in the Knowledge Base. Fill out all mandatory fields, or read How to Use StreamOne Freshdesk to Submit and View Support Tickets for more information.